Not that there was any surprise, but last week President Biden and former President Trump "officially" became the winners of their party's nomination, so the rematch is set. Like most election years I'm already hearing from clients and advisors wanting to "wait until after the election" to make any investment decisions. Like I've done every year since 2009, I will encourage everyone to follow my most often cited piece of advice:
Do not let your political opinions influence your investment decisions.
In case you missed it, here's Part I of our Politics series.

This week we have the Fed meeting and unfortunately every move they make will be under the microscope. I've heard plenty of people on both sides voice concerns about the Fed playing a role in the election. As I told anybody who brought it up, I don't see that as ever being a problem. Chair Powell has faced attacks from both President Trump and President Biden and has not waivered in the direction of Fed policy. For better or for worse they will remain dependent on the economic data.
For what it's worth, based on our economic model and the latest inflation numbers, the Fed should not be doing anything with interest rates. For more, check out last week's economic update.

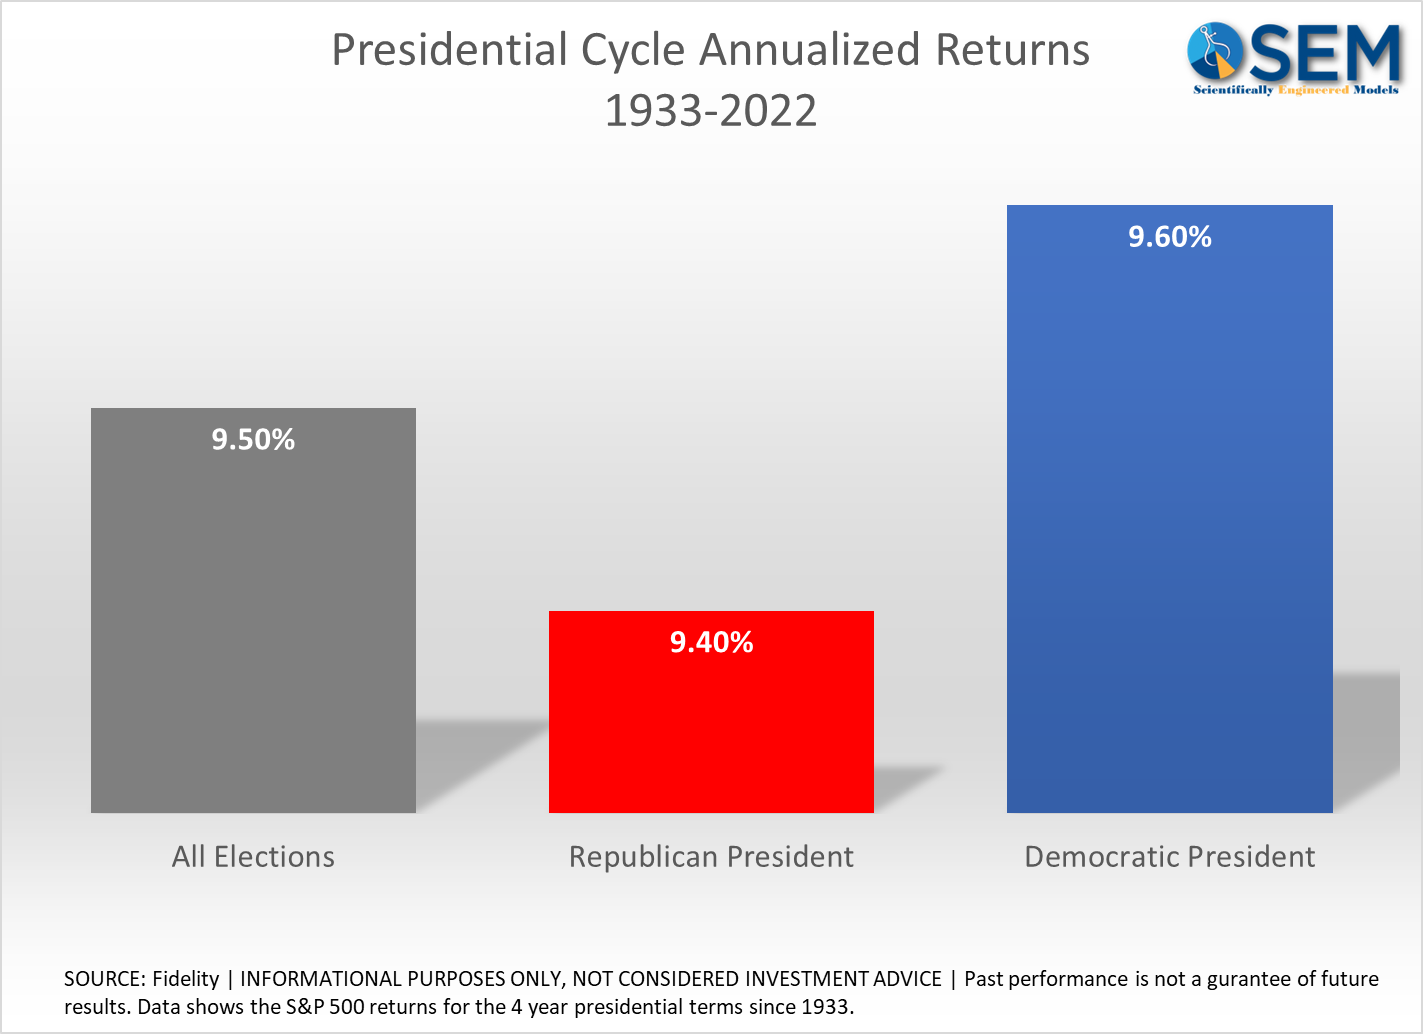
Back to the election. The reason I remind people to not let their political opinions influence their investment decisions is primarily based on data. Quite simply, when you look at which party is in the White House and what it's meant for stocks the difference is essentially a rounding error.
Here's some data going back to 1933 from Fidelity:
What matters more is Congress. The BEST situation historically has been when the opposite party controls congress.
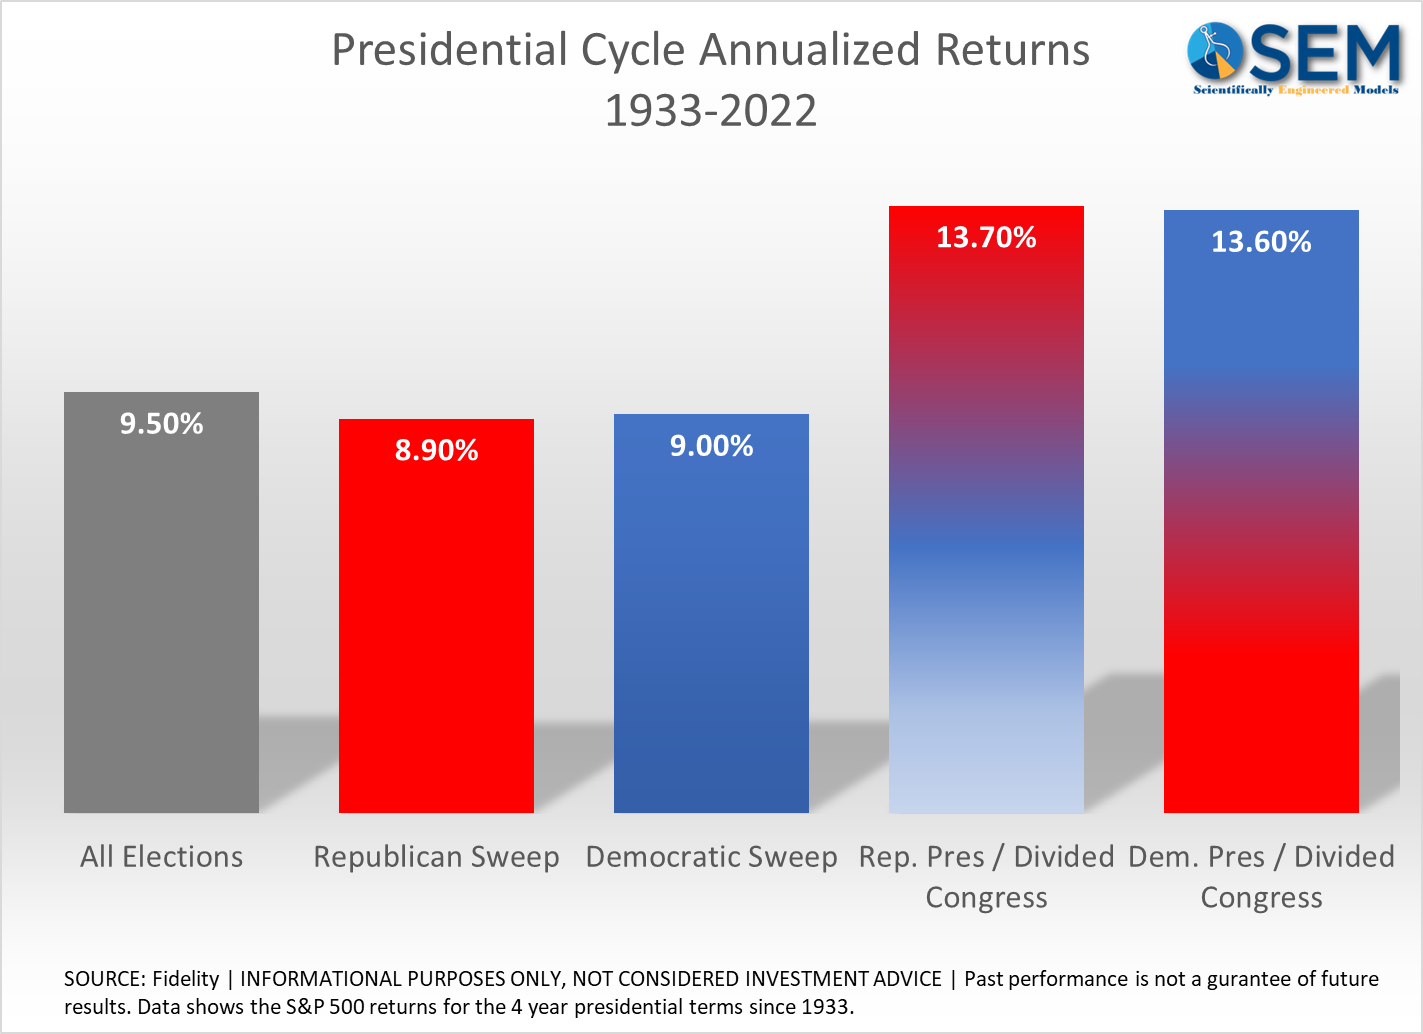
Could it be the market prefers when the only thing that comes out of DC is something both parties agree should happen?
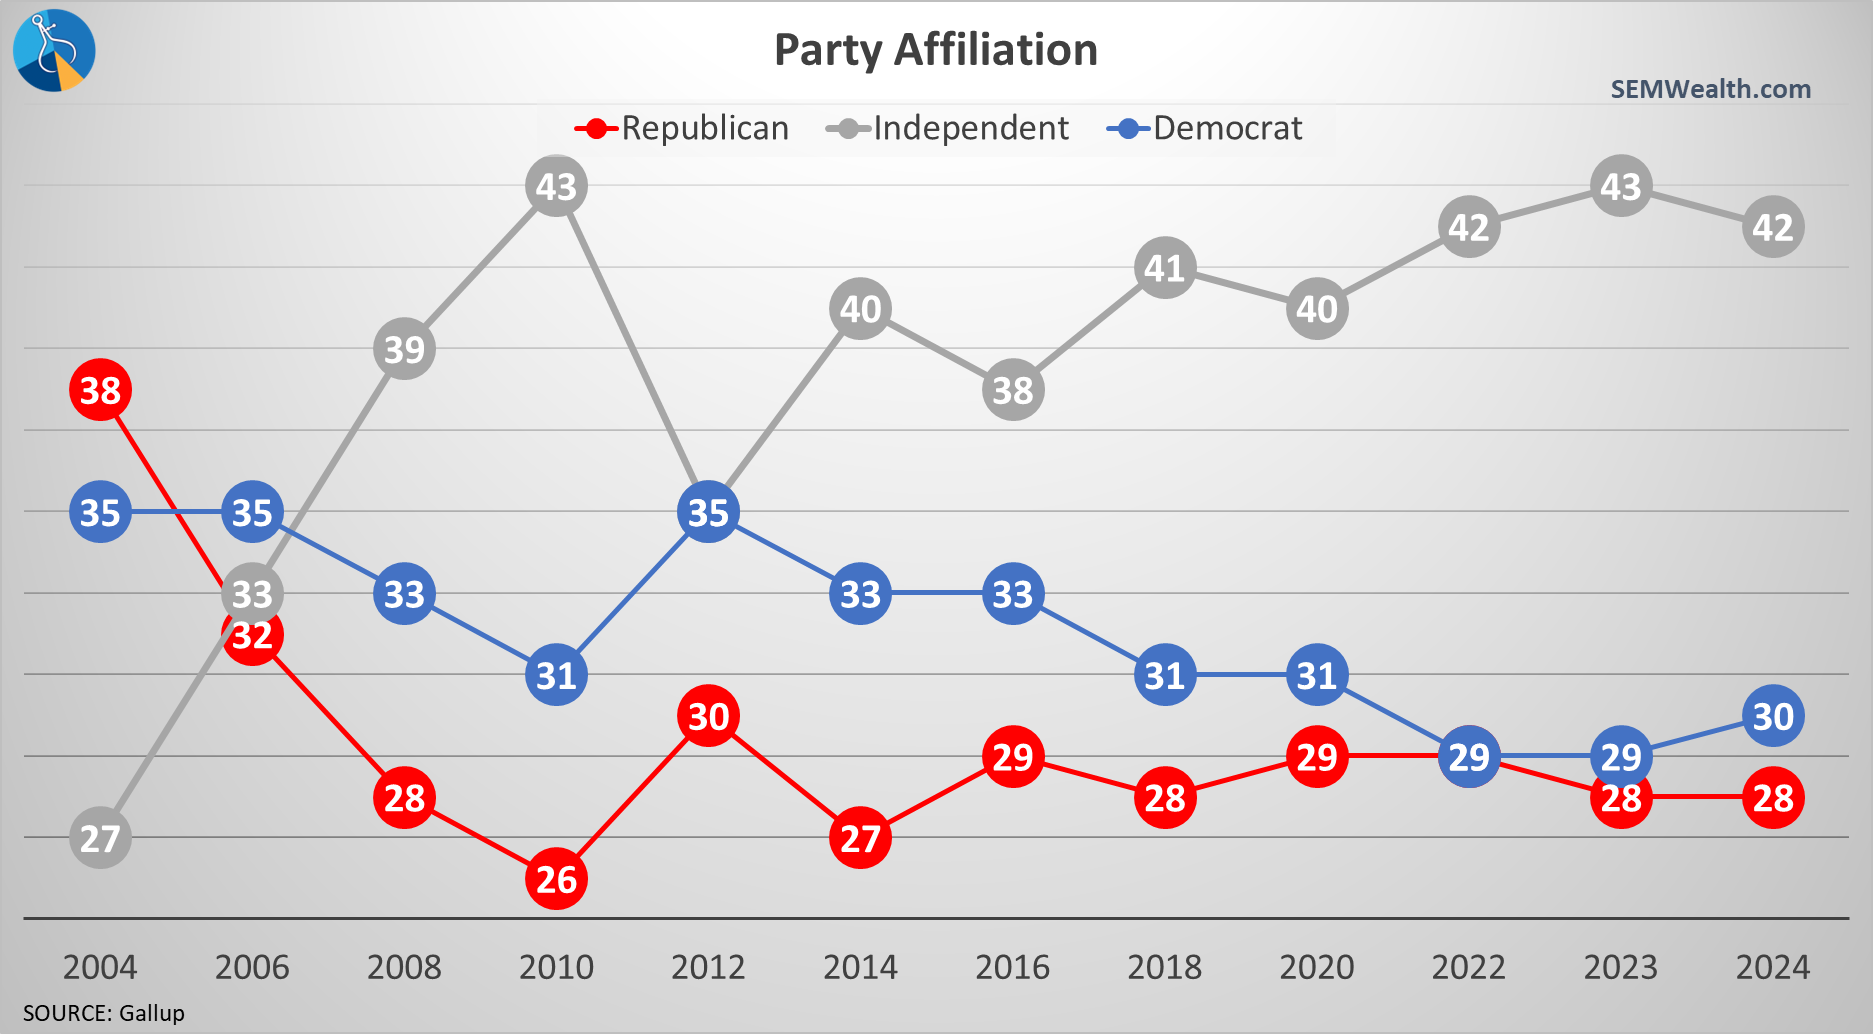
With as divided as everything is this year it is possible we do see a 'sweep' which as you can see is not always the best situation, but it's also not terrible. As it has the last several elections, the winner will be whichever candidate attracts the Independent vote.
It's not always easy or fair to compare presidents and their impact on the stock market (or economy). There are a lot of factors involved including where we are in the economic cycle. That said, here are the annualized returns for the last 7 administrations.
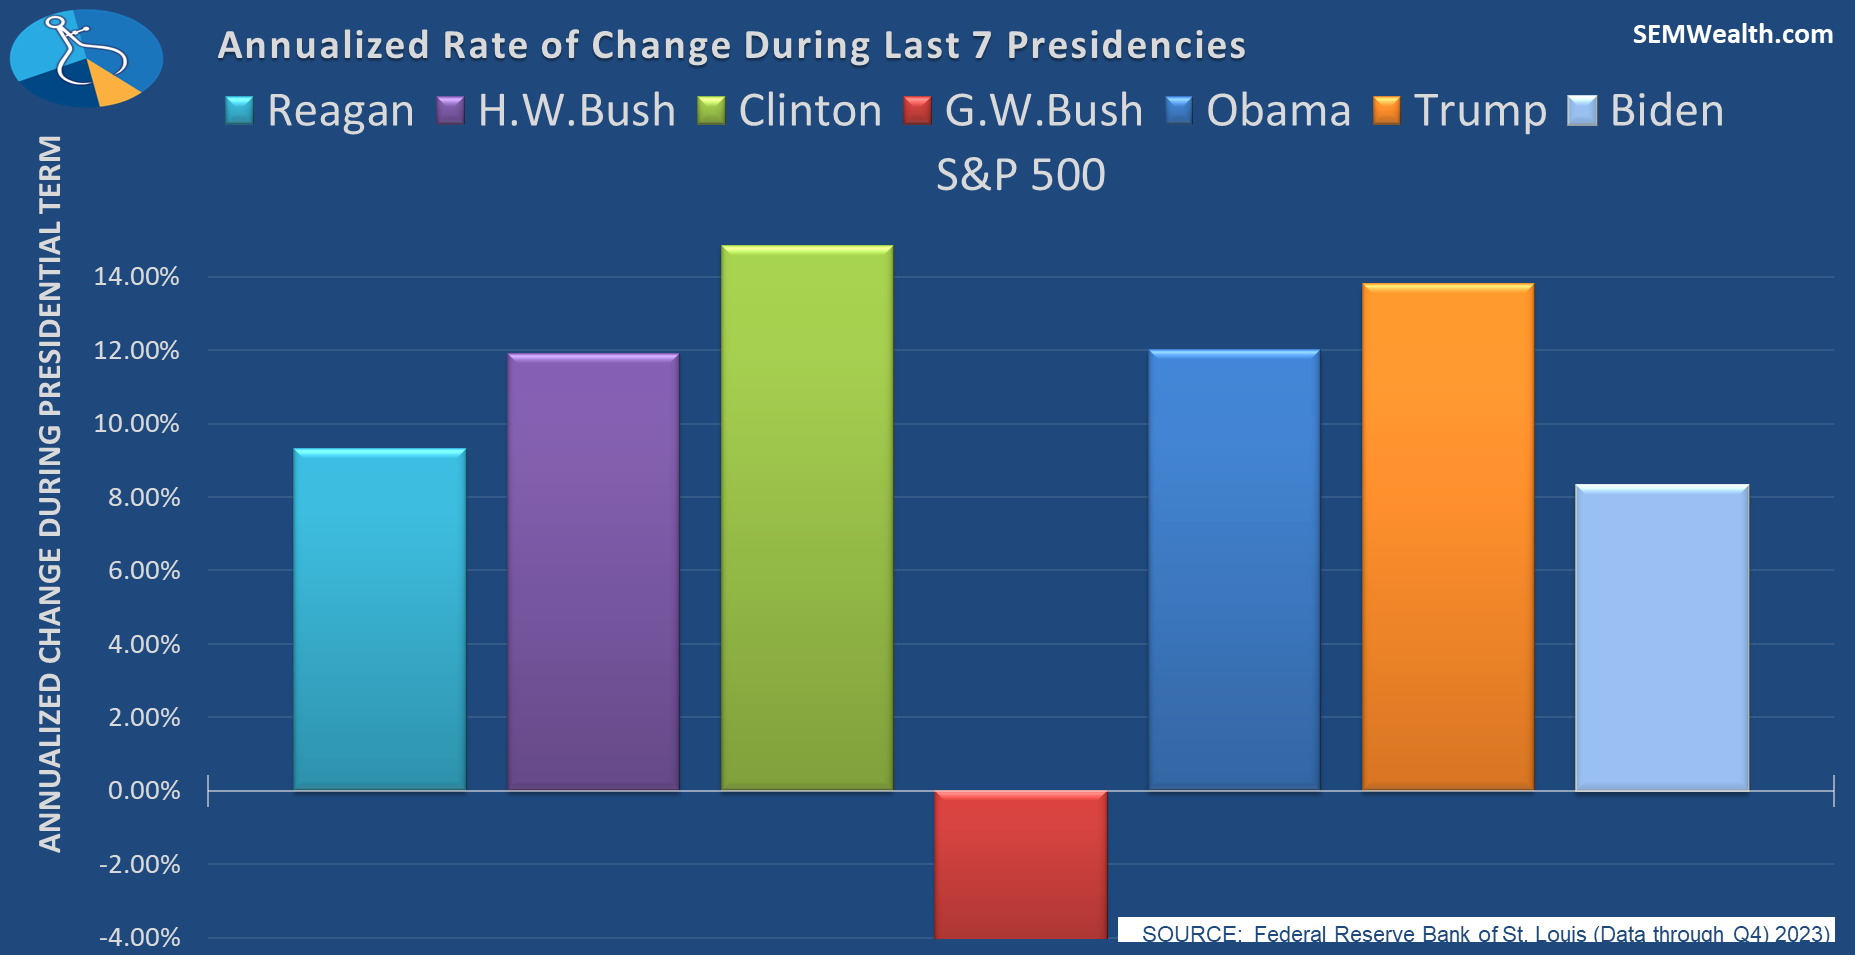
- Republican Ronald Reagan walked into a fragile economy crushed by high inflation near the very end of the inflation fight. Stocks had gone nowhere for over 10 years before he took office.
- Republican George H.W. Bush had the tailwind of the surging incomes of the Babyboom generation. The mini-recession prior to the first Gulf War was a very minor set-back.
- Democrat Bill Clinton oversaw the beginning of the technology boom (and benefited from a split Congress for 6 of his 8 years in office.)
- Republican George W. Bush took over right after the technology crash, endured 9/11 and then oversaw the housing bubble and the implosion of the financial sector.
- Democrat Barak Obama took over right at the end of the financial crash and again benefited from a split Congress for 6 of his 8 years in office.)
- Republican Donald Trump took over with the economy near full-employment, inflation low, and following an economic expansion that lasted nearly as long as the one Bill Clinton had enjoyed. With the massive COVID stimulus the small, quick drop of the stock market during the pandemic was not enough to derail some nice stock market returns.
- Joe Biden took over with inflation already climbing and has been in office for the meme stock bubble, the inflation burst, and the AI-led boom. Despite impressive years in 2021 and 2023 the overall returns so far are the worst for a Democratic president since Jimmy Carter.
Please don't take the above explanation as an endorsement or criticism of that party or administration. Maybe each individual has some influence on the later part of their term, but each was the benefactor or the victim of the PRIOR president's policies.
The main takeaway in terms of the presidency is NEITHER party is 'better' or 'worse' for the stock market. What is initially thought to be true may end up completely untrue before the president's term is over.
Do not let your political opinions influence your investment decisions.
We will have much more on this throughout the year. As a preview, however I found this chart quite interesting.........
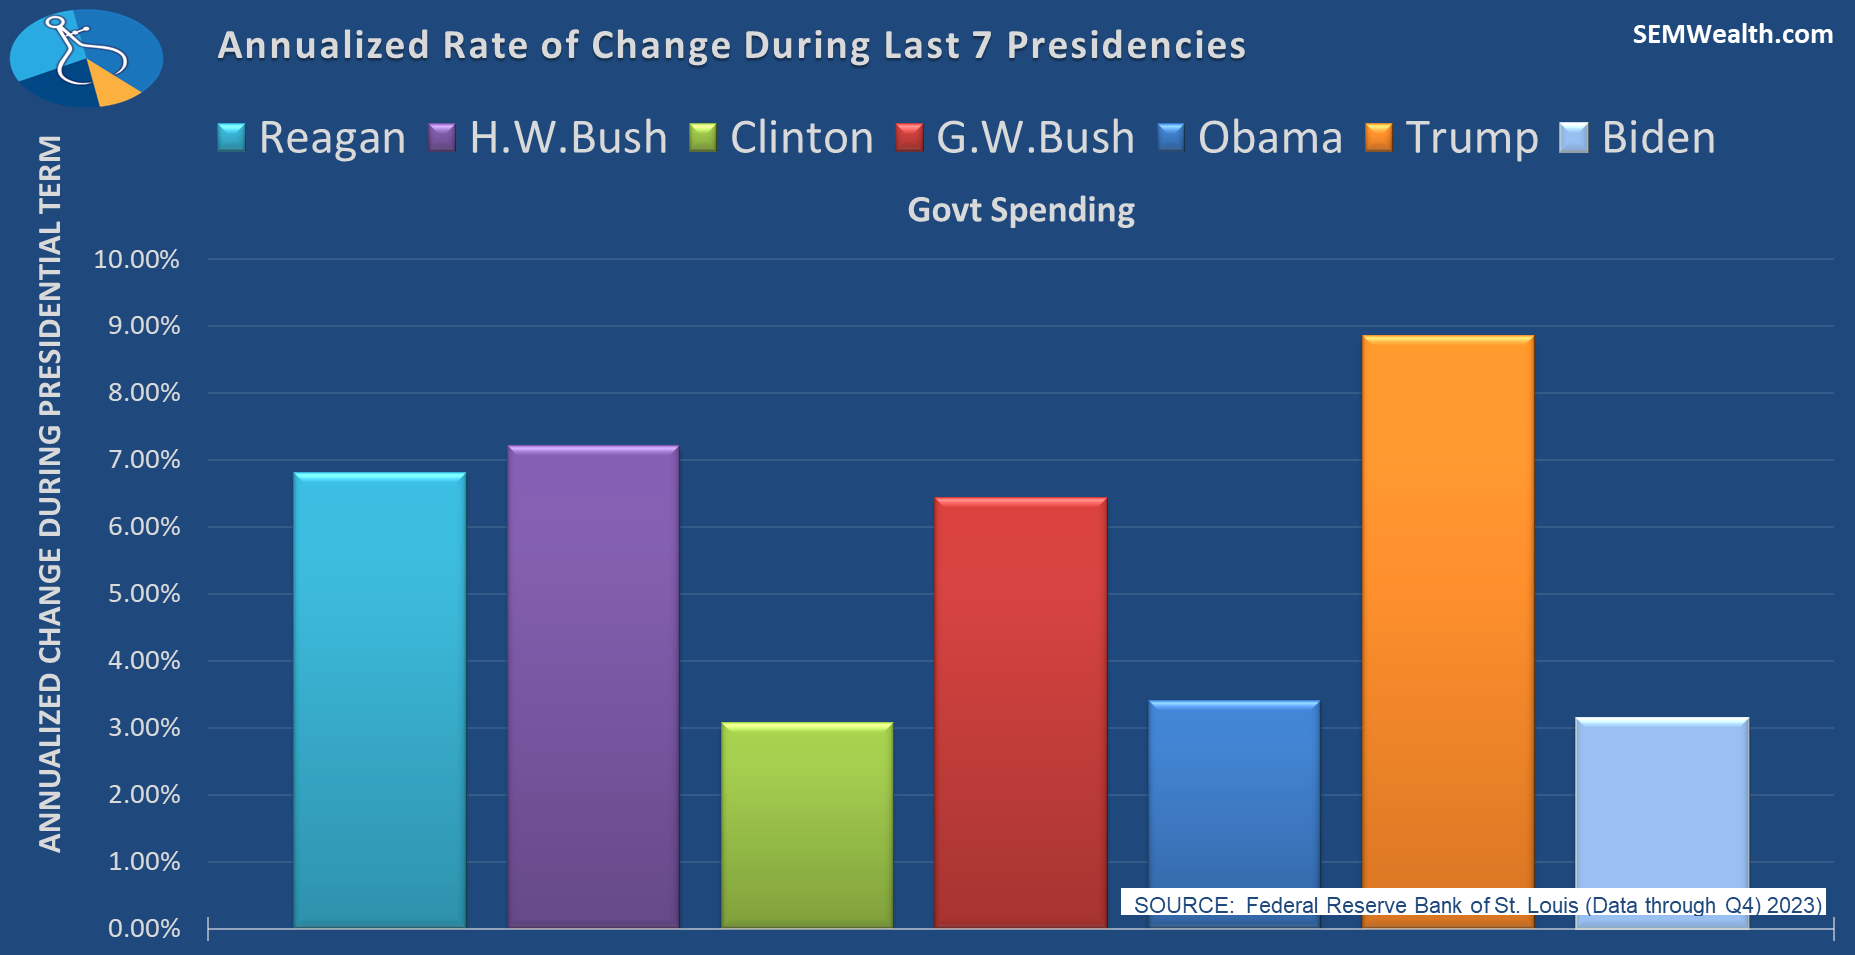
If you were to ask most people which party increases government spending more, the answer would be "the Democrats". However, the 3 SMALLEST increases in government spending came when Biden, Clinton, and Obama were in office.
Again, not a political statement or a statement for or against any of the administrations listed above, but the data does not support the talking points you'll continue to hear over the next several months (and beyond).
Market Charts
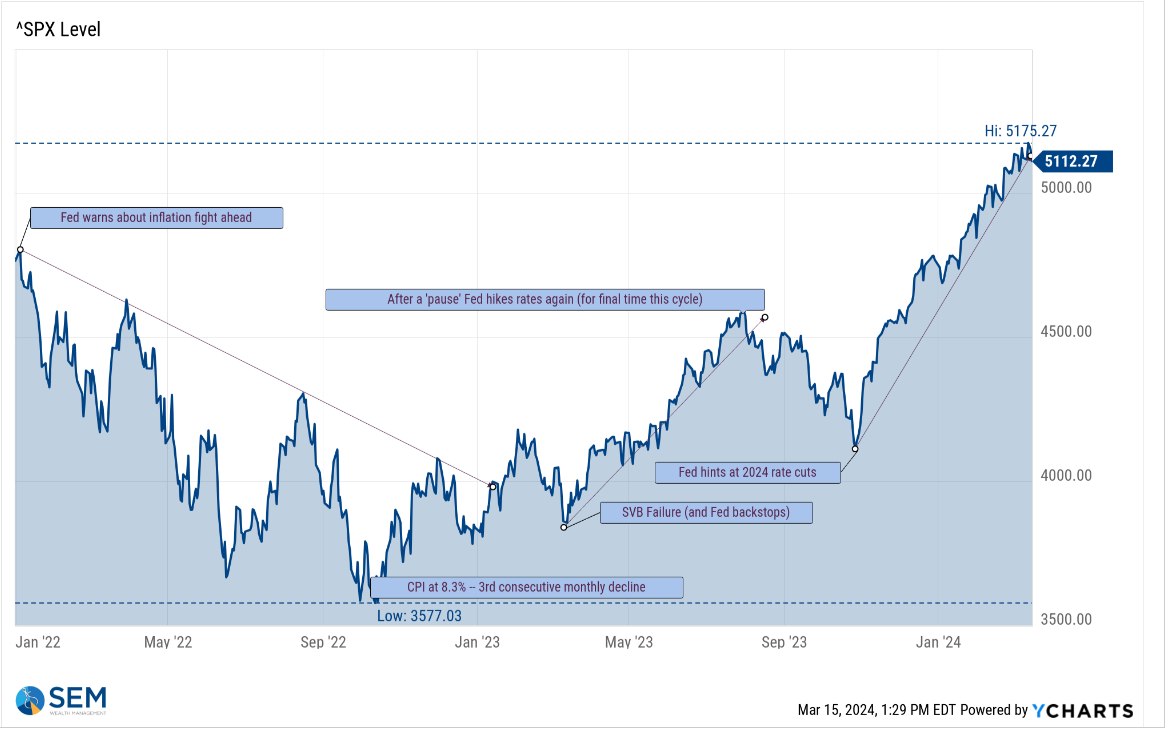
Despite some struggles at the end of last week, the very steep uptrend remains for the S&P 500. This likely means the words coming out of the Fed meeting will be that much more impactful.
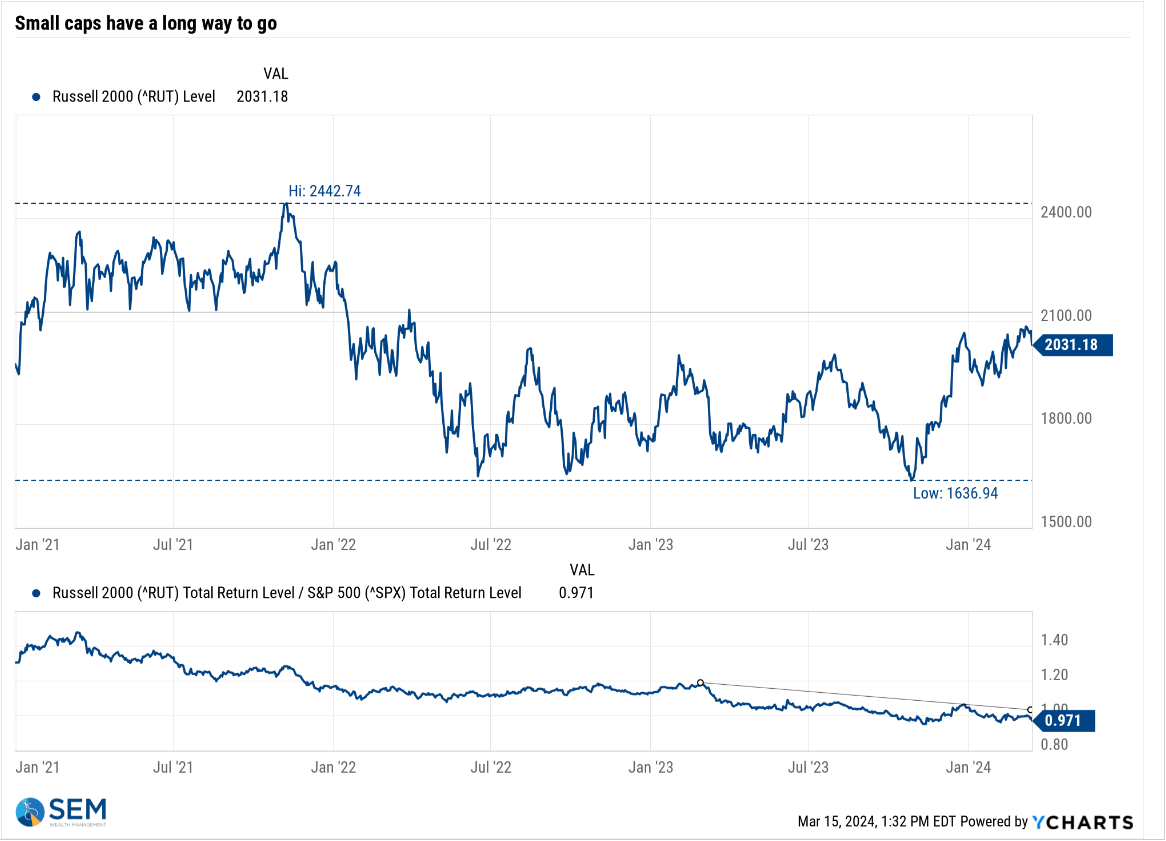
We continue to watch small caps, which are not supporting the argument that the economy is 'strong'.
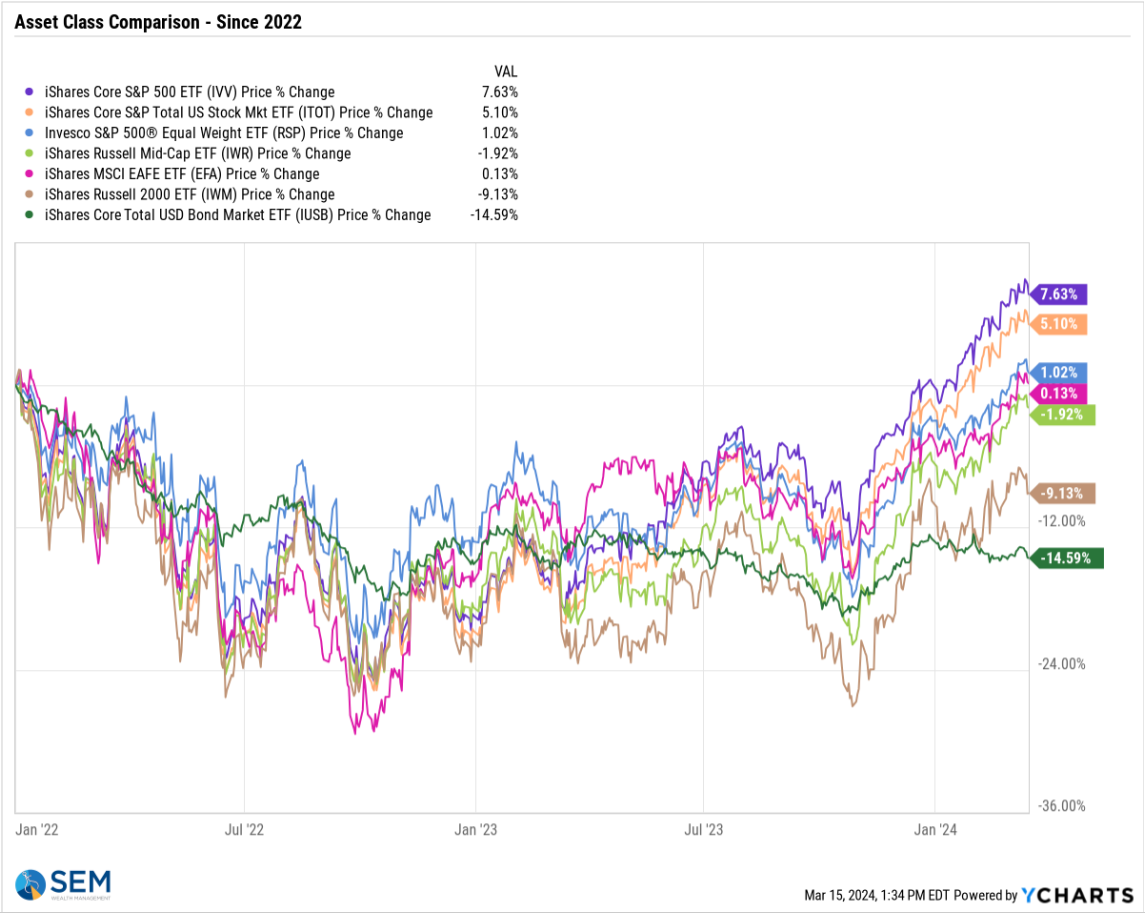
We continue to like to look at the performance of various asset classes since the beginning of 2022. The mega-cap heavy S&P 500 is doing well, but any diversified portfolio is still struggling, especially those who were overweight Small Caps or who decided to buy and hold bonds.
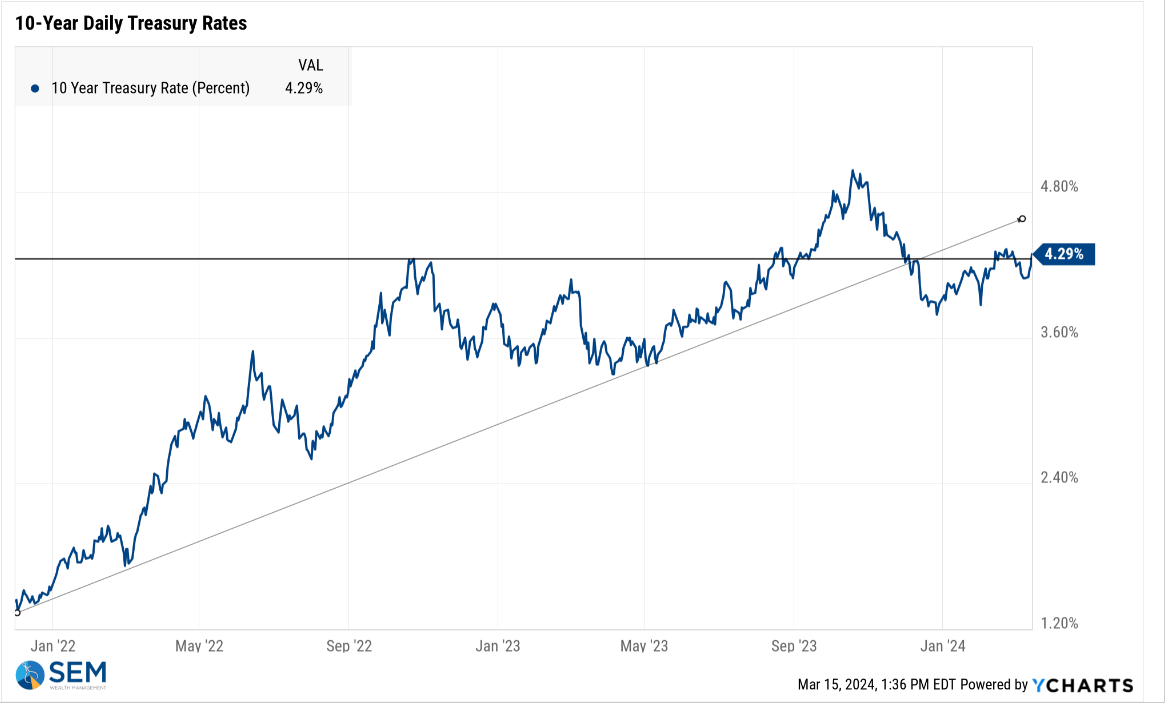
The Treasury Bond market is certainly concerned about inflation not hitting the Fed's target and thus having the Fed not cut rates as aggressively as expected at the start of the year. 10-year rates are right back around the important 4.3% level.
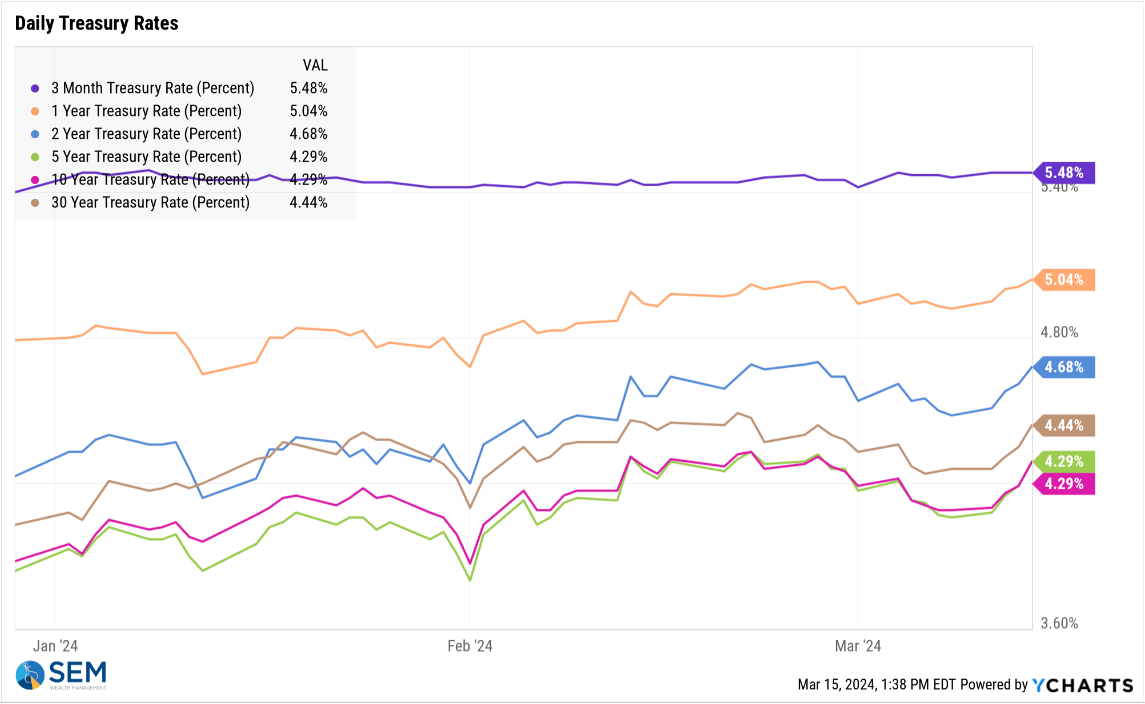
I zoomed into our Treasury Rate chart to look at just the 2024 moves. Rates have moved mostly higher throughout the year across all portions of the yield curve (other than 3-month). Should this continue stocks SHOULD wake up to this reality which could lead to at least a 'small' 5-10% correction.
Earnings cannot grow at above average rates if interest rates remain this high.
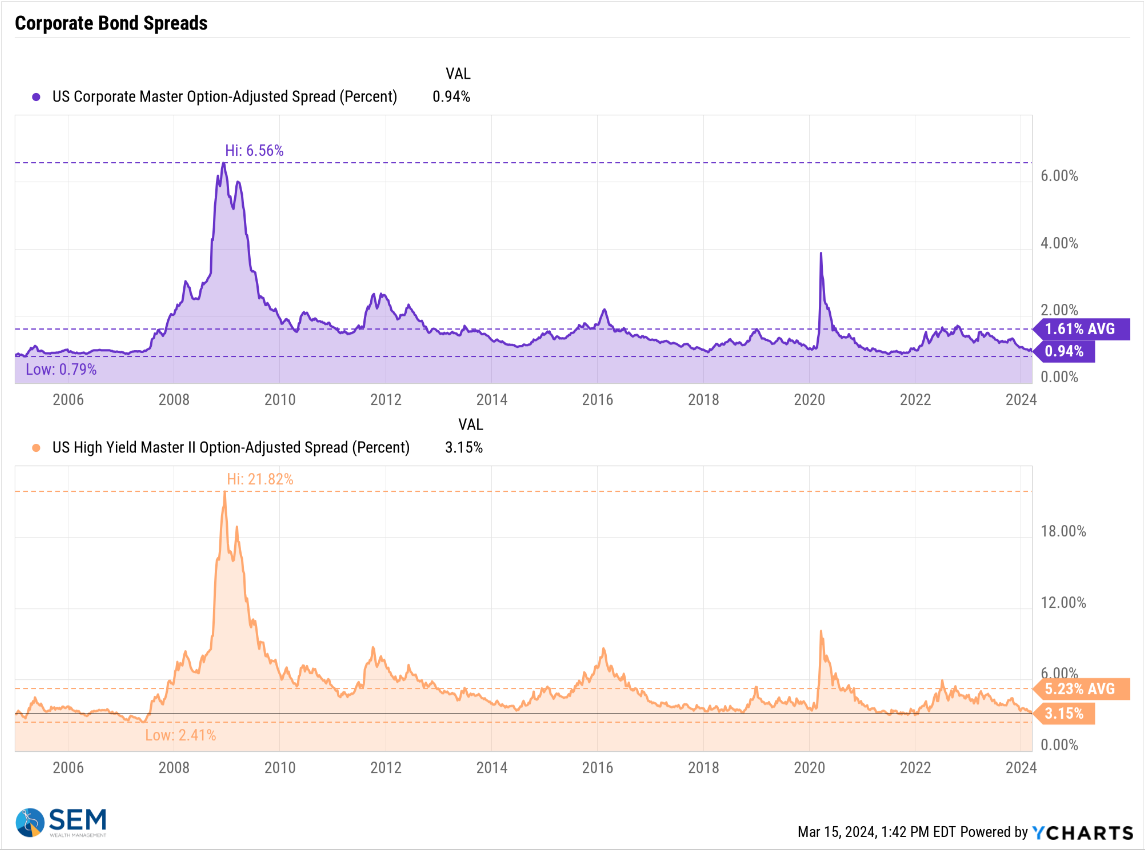
Finally, looking at spreads Investment Grade bond yields are indicating there is no default risk while high yield bonds are not too far behind. Of course the last time spreads were this low was just before the financial system imploded.
Will the Fed be able to engineer a perfect landing where nobody gets hurt? Time will tell, but we aren't putting our faith in them.
That said our models are certainly enjoying this 'goldilocks' scenario. Stay tuned to the section below for any updates to our positioning.
SEM Model Positioning
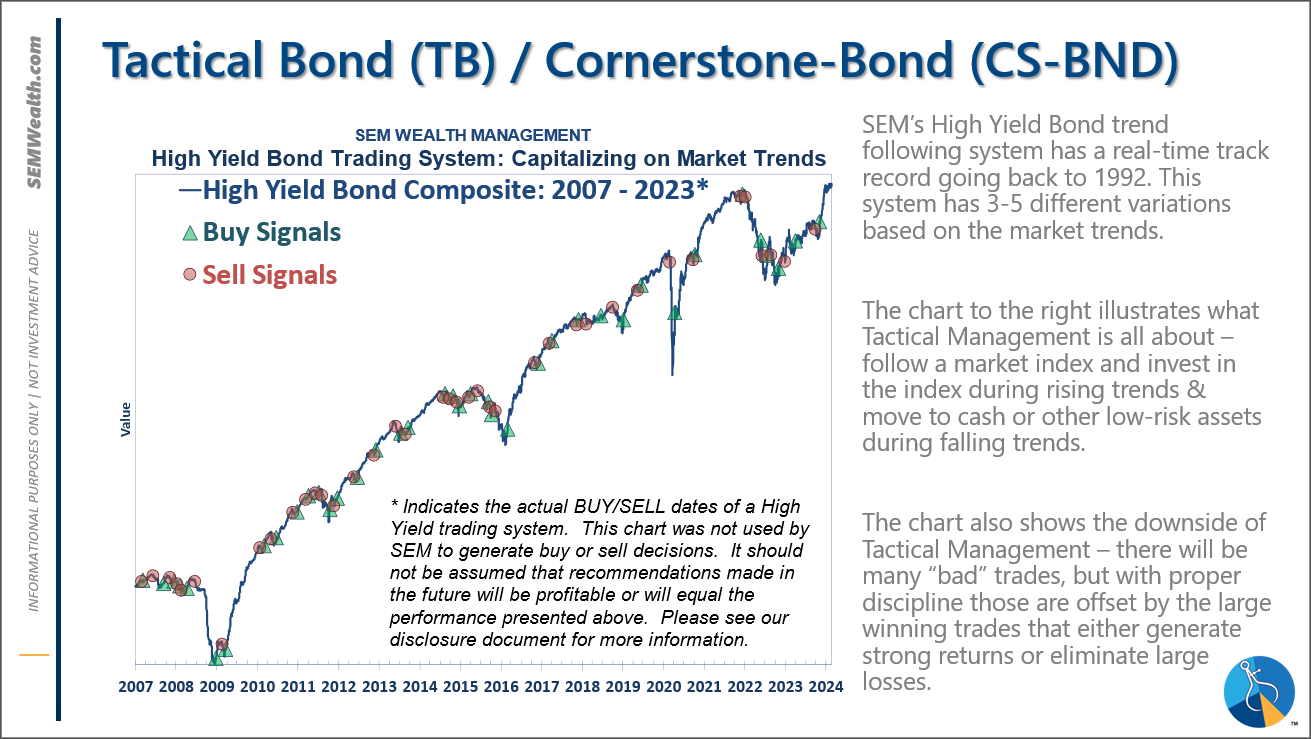
-Tactical High Yield went on a buy 11/3/2023
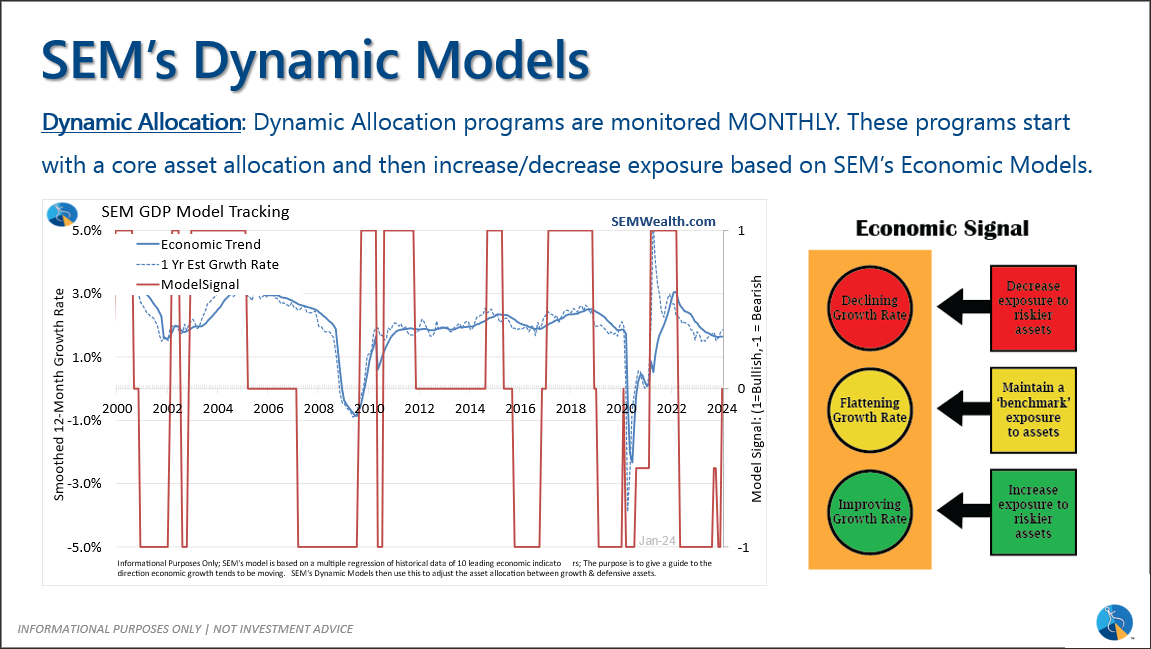
-Dynamic Models went to 'neutral' 2/5/2024
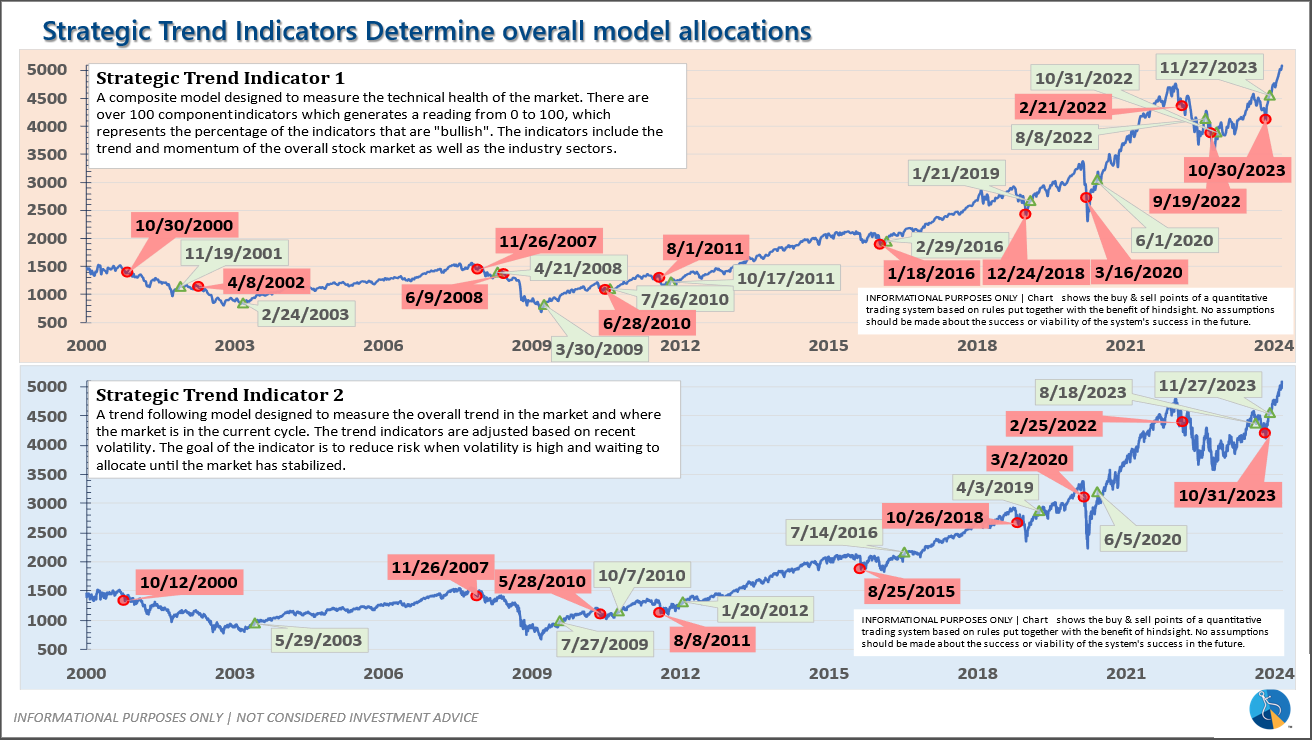
-Strategic Trend Models went on a buy 11/27/2023
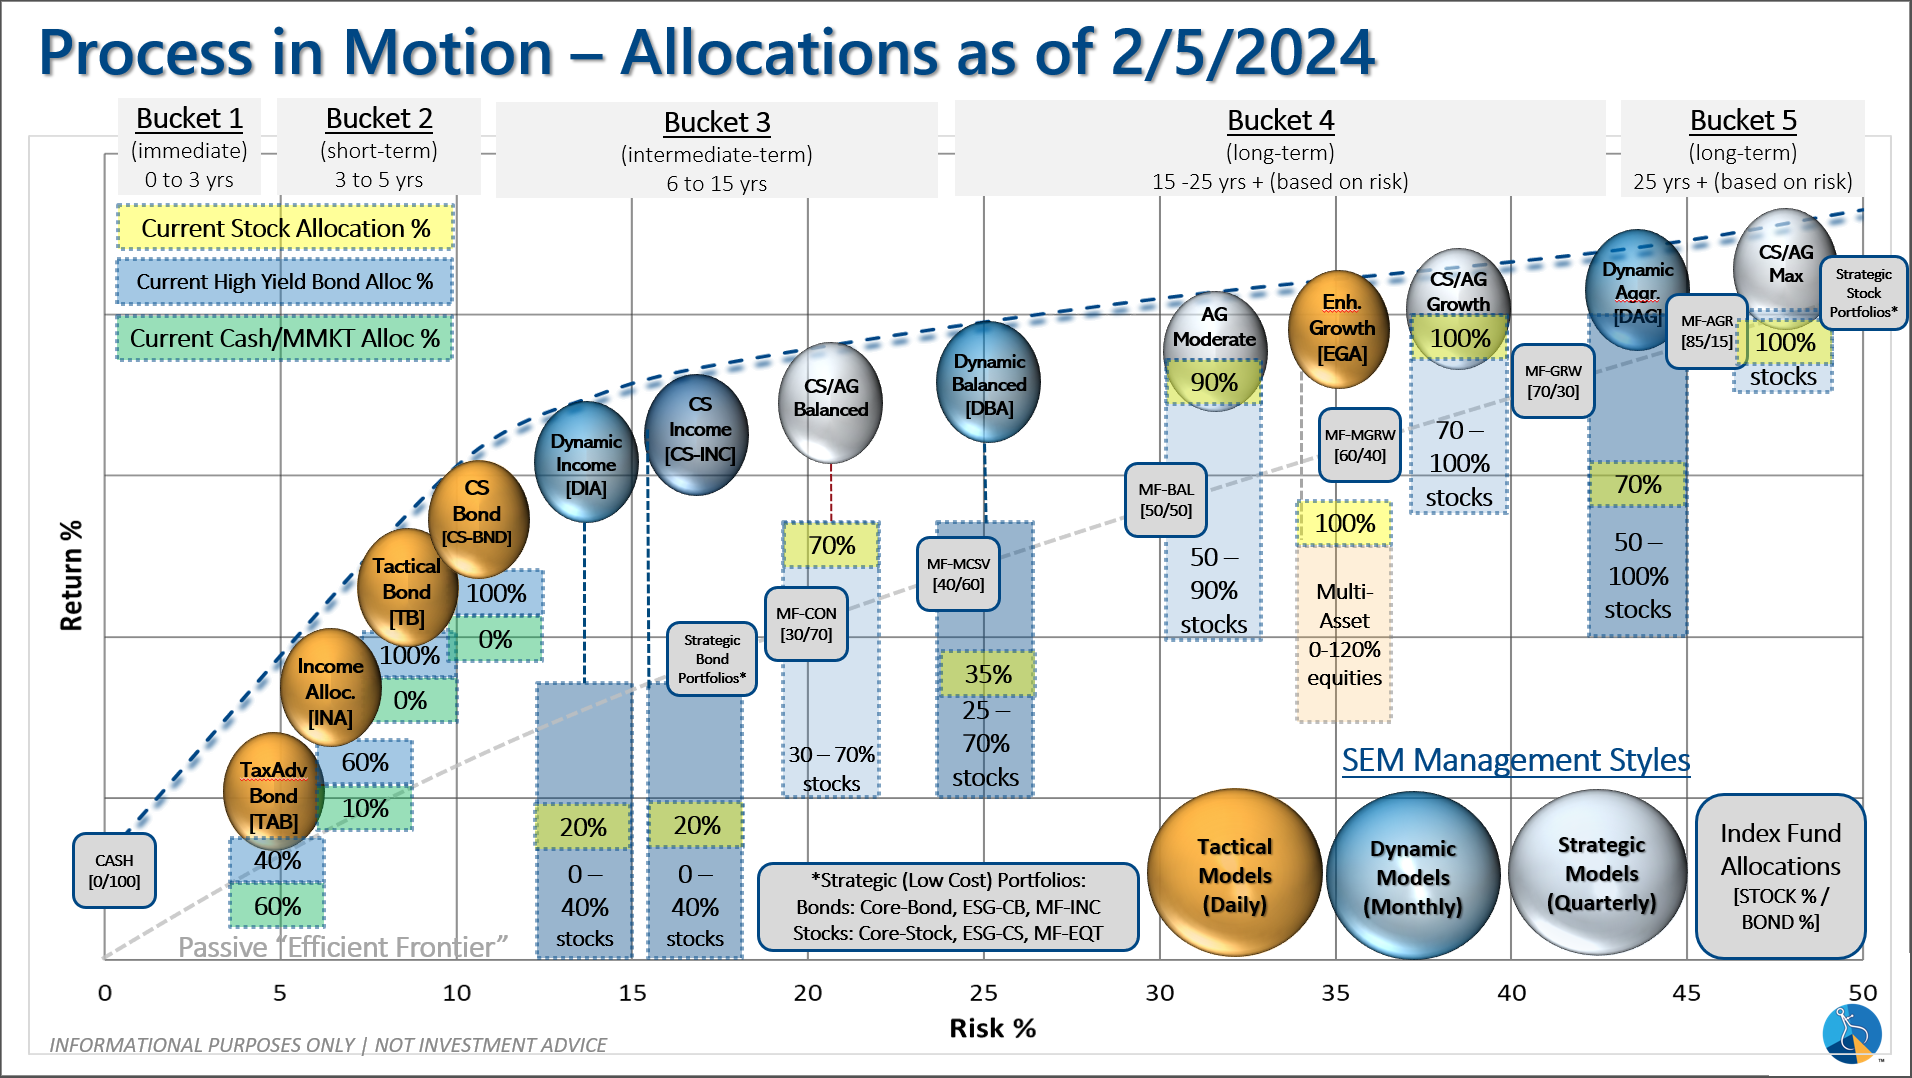
SEM deploys 3 distinct approaches – Tactical, Dynamic, and Strategic. These systems have been described as 'daily, monthly, quarterly' given how often they may make adjustments. Here is where they each stand.
Tactical (daily): The High Yield Bond system bought the beginning of April and issued all 3 sell signals 9/28/2023. All 3 systems were back on buy signals by the close on 11/3/2023. The bond funds we are invested in are a bit more 'conservative' than the overall index, but still yielding between 7.5 -8.5% annually.
Dynamic (monthly): At the beginning of December the economic model reverted back to "bearish". This was reversed at the beginning of February. This means benchmark positions – 20% dividend stocks in Dynamic Income and 20% small cap stocks in Dynamic Aggressive Growth.
Strategic (quarterly)*:
BOTH Trend Systems reversed back to a buy on 11/27/2023
The core rotation is adjusted quarterly. On August 17 it rotated out of mid-cap growth and into small cap value. It also sold some large cap value to buy some large cap blend and growth. The large cap purchases were in actively managed funds with more diversification than the S&P 500 (banking on the market broadening out beyond the top 5-10 stocks.) On January 8 it rotated completely out of small cap value and mid-cap growth to purchase another broad (more diversified) large cap blend fund along with a Dividend Growth fund.
The * in quarterly is for the trend models. These models are watched daily but they trade infrequently based on readings of where each believe we are in the cycle. The trend systems can be susceptible to "whipsaws" as we saw with the recent sell and buy signals at the end of October and November. The goal of the systems is to miss major downturns in the market. Risks are high when the market has been stampeding higher as it has for most of 2023. This means sometimes selling too soon. As we saw with the recent trade, the systems can quickly reverse if they are wrong.
Overall, this is how our various models stack up based on the last allocation change: